
Airbnb’s IPO filing was made public Monday and we finally get a look inside the company through its numbers.
Airbnb has build a strong brand equity. About 91% of its booking traffic is organic this year – granted that it cut all paid ad spend in early spring to reduce costs. The fact that it can drive traffic from direct or unpaid channels to its website without Google speaks to its brand strength.
In a nutshell, Airbnb’s S-1 shows a business model that is agile and capital efficient as it crosses the boundaries of travel, housing and recreation.
Travel is one of the world’s largest industries, and its approach has become commoditized. The travel industry has scaled by offering standardized accommodations in crowded hotel districts and frequently-visited landmarks and attractions. This one-size-fits-all approach has limited how much of the world a person can access, and as a result, guests are often left feeling like outsiders in the places they visit.
Airbnb S-1
Airbnb is a host-centric company – “Airbnb enables hosts to provide guests access to a vast world of unique homes and experiences that were previously inaccessible, or even undiscovered.” Hosts provide a unique inventory “in nearly every corner of the world” without Airbnb absorbing any carrying costs for the physical space.
Market Opportunity
$1.5 Trillion Serviceable Addressable Market (SAM)
– $1.2 trillion in stays
– $239 billion in experiences
$3.4 Trillion Total Addressable Market (TAM)
By category
– $1.8 trillion in short term stays
– $210 billion in long term stays
– $1.4 trillion in experiences (includes experiences SAM + $1.1 trillion of spend from local residents on recreational and cultural attractions including sporting events, amusement parks, summer camps, and more)
By geography
– $1.7 trillion Asia
– $1.0 trillion Europe
– $0.7 trillion North America
– $0.2 trillion Latin America
Two areas to watch are long term stays and lower penetrated markets as Airbnb continues to leverage its brand.
Long term stays accounted for 14% of nights booked in 2019 and 24% for the nine-months ended September 30, 2020. Long term stays is a growth opportunity for Airbnb given the accelerated acceptance of remote work. Airbnb has capitalized on this trend and is pushing a vision of “work from any home” and is making a push into the housing space.
For long-term stays, we calculate that we can address our estimate for the entire $48 billion global serviced apartment market and 10% of the $1.6 trillion global residential rental market, or $162 billion.
Airbnb S-1
A primary focus of its global expansion is under penetrated markets such as India, China, Latin America, Southeast Asia with a more localized product.
We will make Airbnb more accessible in more places by further localizing our product… Finally, we plan to continue to invest in our brand in China, Aibiying, to better serve our Chinese hosts and guests.
Airbnb S-1
Airbnb’s Business – Hosts, Guests, Market, and COVID-19 Impact
Hosts
- 4 million hosts, 86% outside of the U.S.
- 7.4 million listings for stays and experiences
- 5.6 million active listings (AL), 76% of AL booked so far this year and 90% of AL booked in last 24 months.
- 79% of hosts come to Airbnb organically in 2019
- 23% of hosts started as guests in 2019
- 850,000 are Superhosts, or 21% of hosts achieved Superhost status as of September 30, 2020.
Guests
- 54 million guests: 247 million guests arrivals booked 327 million nights and experiences in 2019
- 91% of booking traffic is organic in first nine months of 2020
- 68% left reviews in 2019
- 69% of revenues from repeated stay guests in 2019
Market
- 100,000 cities in more than 220 countries
- 63% of revenue generated outside of the U.S. in 2019
- Cancellations typically averaged around 13% of gross bookings
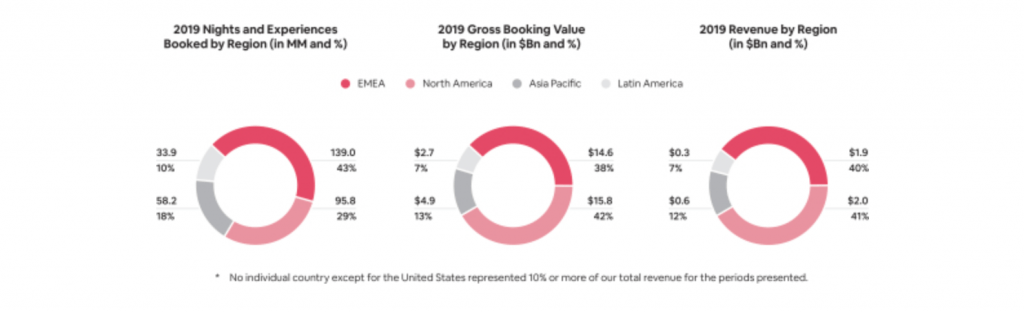
- Europe and North America represented the largest regions by Nights and Experiences Booked (bookings), Gross Booking Value (GBV), and revenue in 2019
COVID Impact for the Nine Months Ended Sep 30, 2020
- $18.0 billion GBV, down 39% year-over-year and revenue of $2.5 billion, down 32% year-over-year
- 41% drop in bookings to 146.9 million from 251.1 million for the comparative prior year period; most severe in the second quarter which was down 67%
- 72% year-over-year drop in gross bookings in April 2020; otherwise held steady, declining by 20% (or about 28% factoring for cancellations) from June-September
- Increased in gross daily rate (GDR) due to faster recovery in North America and Europe and a greater mix of higher-priced, non-urban listings limited further downside in GBV
- Domestic travel accounted for 77% of bookings compared to 52% in January 2020, and domestic bookings grew 14% year-over-year
- 52% drop in bookings in the top 20 cities by GBV in September 2020 compared to a year ago
Volatility remains as countries continue to grapple with COVID-19. Airbnb cautioned that another wave of infections and lockdowns, especially in Europe, will impact its fourth quarter. Airbnb is seeing bookings declining and cancellations increasing compared to the third quarter of 2020.


